If you’re serious about growing your wealth, just buying investments is only half the battle. Truly understanding your portfolio – its performance, diversification, and how it aligns with your goals – is where the real magic happens. As an engineer, I’ve always appreciated the power of data and efficient systems. That’s why I’ve developed a method using M1 Finance, basic Excel, and Google Sheets to perform in-depth portfolio analysis. While M1 Finance is fantastic for long-term, automated investing (more on that later!), sometimes you want to dig deeper with custom metrics and visualizations.
Manual tracking can be a gut-wrenching process, as I noted when I first wrote about this. But with a streamlined system, it becomes an empowering tool. This guide will walk you through my updated step-by-step process for exporting your holdings and leveraging the power of spreadsheets to gain valuable insights into your investments. The principles here can be adapted even if you use other brokerages too!
Why Go Beyond Standard Brokerage Dashboards?
Most brokerage platforms provide decent overviews of your portfolio. So, why put in the extra effort to create your own analysis in Excel or Google Sheets? For me, it comes down to a few key advantages:
- Deeper Insights: You can calculate custom metrics that your brokerage might not offer, like granular sector exposure, true cost basis including fees (if applicable), or even your own qualitative investment ratings.
- Enhanced Visualization: Create charts and graphs tailored to how you want to see your data, helping you spot trends or imbalances more easily.
- Centralized Tracking: If you have investments across multiple platforms (though I love the consolidation M1 offers!), a custom spreadsheet can bring it all together.
- Informed Decision-Making: A thorough analysis helps with rebalancing, identifying candidates for tax-loss harvesting, and ensuring your portfolio stays aligned with your financial objectives like those discussed in my Intrinsic Value [Part 1] and Intrinsic Value [Part 2] posts.
- Understanding Risk: You can better assess concentration risk, your portfolio’s beta, and other risk factors.
The Core Toolkit: M1 Finance, Excel, and Google Sheets
My system revolves around these three powerful tools:
💰 M1 Finance: My Go-To for Automated Investing
M1 Finance is exceptional for its “pie-based” investing system, which allows for easy custom allocations and auto-rebalancing. It’s designed for long-term focused investment management. If you’re looking to streamline your investing and build wealth systematically, M1 is a fantastic platform.
Use my link below, and you can get $75 when you fund a new M1 investment account!
(I can be rewarded if you sign up and fund an account using this link.)
My Updated Step-by-Step Portfolio Analysis Process
Let’s get into the nuts and bolts of how I turn raw brokerage data into actionable insights.
Step 1: Exporting Holdings from M1 Finance (or Your Brokerage)
The first step is to get your holdings data out of your brokerage account. In M1 Finance, you can typically find your holdings on the main portfolio or “Holdings” page. In the past, I mentioned a drag-and-drop method, but M1 and most brokerages now offer more straightforward ways to get your data, often via a CSV export feature. Look for an “Export” or “Download” button on your holdings or activity page.

If a direct CSV export isn’t available or is poorly formatted, you might need to carefully copy the data from the webpage and paste it into Excel or Google Sheets. This might require some initial cleanup.
Step 2: Initial Data Cleaning & Structuring in Excel (Optional but Recommended)
Once you have your raw data, I often find it helpful to do an initial cleanup in Microsoft Excel, especially if the export is messy or if I’m combining data from multiple sources. The goal here is to get clean, usable columns, primarily: Ticker Symbol, Number of Shares, and Average Cost Per Share (or Total Cost Basis).
Tasks in Excel might include:
- Deleting unnecessary rows or columns (like promotional text or empty cells).
- Ensuring data types are correct (numbers for shares and prices).
- Using formulas like
TRIMto remove extra spaces, orTEXTSPLIT(in newer Excel versions) if data is clumped in one cell. - In my original post, I mentioned a specific complex formula for data extraction. More generally, functions like
INDEX,MATCH,VLOOKUP, or Excel’s Power Query tool can be incredibly powerful for reshaping and cleaning data from less-than-ideal export formats.

Step 3: Importing to Google Sheets & Unleashing GOOGLEFINANCE
With your data cleaned, it’s time to move it to Google Sheets. You can simply copy and paste from Excel or import the CSV file directly.
This is where the magic happens, thanks largely to the GOOGLEFINANCE function. This powerful tool can fetch a wealth of information. For a comprehensive guide, check out the official GOOGLEFINANCE documentation.
Some common uses:
- Current Price:
=GOOGLEFINANCE("TICKER", "price")(e.g.,=GOOGLEFINANCE("GOOG", "price")) - Company Name:
=GOOGLEFINANCE("TICKER", "name") - Price-to-Earnings (P/E) Ratio:
=GOOGLEFINANCE("TICKER", "pe") - Earnings Per Share (EPS):
=GOOGLEFINANCE("TICKER", "eps") - Market Capitalization:
=GOOGLEFINANCE("TICKER", "marketcap") - 52-Week High/Low:
=GOOGLEFINANCE("TICKER", "high52")/=GOOGLEFINANCE("TICKER", "low52") - Historical Data: You can pull daily, weekly, or monthly price data for specific periods to track performance or create charts.
For data not directly available via GOOGLEFINANCE (like specific dividend yields or analyst ratings from certain websites), you can sometimes use functions like IMPORTHTML or IMPORTXML, though these can be less reliable as website structures change.
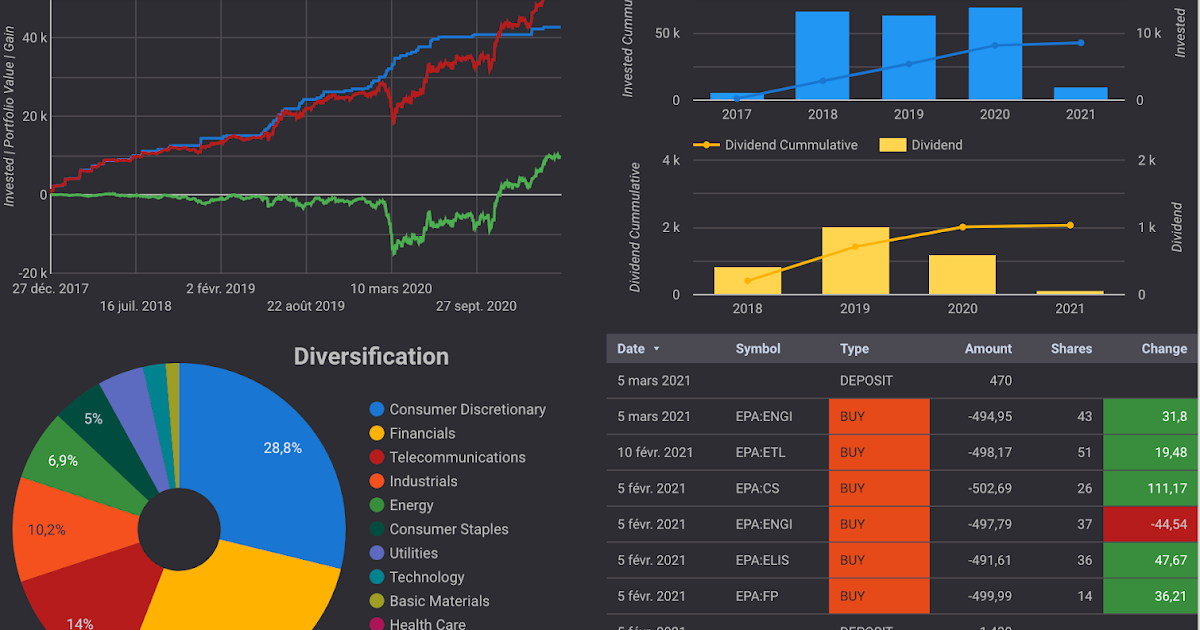
Step 4: Building Your Analysis Dashboard in Google Sheets
This is where you assemble your data into a comprehensive dashboard. Here’s an example of how my sheet evolved (this screenshot is from a 2020 update):

Based on my original post, I’d copy the Ticker, Shares, and Average Price from my Excel sheet into Columns A, B, and C of the Google Sheet. Then, the rest of the analysis can be largely automated with formulas.
Essential Columns to Create & Track:
- Ticker (Column A – Imported)
- Shares (Column B – Imported)
- Avg. Cost/Share (Column C – Imported)
- Company Name:
=IF(ISBLANK(A2), "", GOOGLEFINANCE(A2, "name")) - Current Price:
=IF(ISBLANK(A2), "", GOOGLEFINANCE(A2, "price")) - Market Value:
=B2*E2(Shares * Current Price) - Cost Basis:
=B2*C2(Shares * Avg. Cost/Share) - Gain/Loss ($):
=F2-G2(Market Value – Cost Basis) - Gain/Loss (%):
=IF(G2=0, "", H2/G2)(Format as percentage) - P/E Ratio:
=IF(ISBLANK(A2), "", GOOGLEFINANCE(A2, "pe")) - Sector/Industry: This often requires manual input or a lookup table if you classify your stocks.
- % of Portfolio: (Market Value of this stock / Total Market Value of Portfolio) – requires a cell with total portfolio value.
- Dividend Yield (%):
=IF(ISBLANK(A2),"",GOOGLEFINANCE(A2,"yieldpct"))(Note: `yieldpct` provides the dividend yield as a percentage. For the actual dividend amount, you might use `GOOGLEFINANCE(A2, “dividend”)` for the last cash dividend per share, but annualizing it requires care). - Notes/Conviction Level: A subjective column for your thoughts, as I mentioned in my original post.
Step 5: Advanced Analysis – Sector Aggregation & Performance Visualization
Once your individual holdings are tracked, you can perform higher-level analysis. As shown in my 2020 update, I added aggregate data on how each sector in my portfolio was performing.

You can achieve this using functions like SUMIF, SUMIFS, or the powerful QUERY function in Google Sheets. For example, to sum the market value of all holdings in the “Technology” sector (assuming your sectors are in Column K and market values in Column F):
=SUMIF(K:K, "Technology", F:F)
Google Sheets also has excellent built-in charting capabilities. You can create:
- Pie charts to visualize your asset allocation by sector or individual holding.
- Bar charts to compare the performance of different investments or sectors.
- Line charts to track your portfolio’s value over time (this requires historical data logging).
Streamlining Your Investment Management
As I said back in 2019, “Today was not wasted. Moving forward, what used to be a gut-wrenching manual process is now automated.” Once this spreadsheet is set up, keeping it updated is much simpler. For M1 Finance users, periodic exports and pastes into your master sheet can keep your analysis fresh. Now, I can drag and drop (or copy-paste) my holdings and make informed decisions when needed.
🛠️ Adapting for Other Brokerages (Robinhood, Webull, etc.)
While this guide focuses on my M1 Finance workflow, the core principles of exporting data (usually as a CSV) and analyzing it in Google Sheets apply to virtually any brokerage. Platforms like Robinhood and Webull also allow you to access your holdings data, which you can then bring into a similar spreadsheet system.
Thinking of trying out a new platform or diversifying your brokerage accounts?
- Sign up for Robinhood and we’ll both pick a free gift stock 🎁 → https://join.robinhood.com/rockeim1
- Join Webull today and get up to 20 FREE stocks! → https://a.webull.com/0EqAa3ekH51zWLMXi9
(Using these links may result in a reward for both of us!)
Next Steps & Further Enhancements
Your portfolio analysis spreadsheet can evolve over time. Here are some ideas for “next steps” that I considered (and some I’ve implemented):
- Integrate More Data Points: Pull in data from sources like TipRanks for “Smart Scores,” or your own calculated Fair/Intrinsic Values (referencing my posts on Intrinsic Value [Part 1] and Part 2).
- Conditional Formatting: Use colors to visually highlight gains/losses, over/undervalued stocks based on your criteria, or P/E ratios outside your preferred range.
- Dividend Tracking: Add columns to track expected annual dividend income per holding and for the total portfolio.
- Automated Alerts: For more advanced users, Google Apps Script could be used to send email alerts if a stock hits a certain price target or if portfolio allocation drifts too far.
- Transaction Log: Maintain a separate tab for all buy/sell transactions to accurately calculate cost basis and realized gains/losses.
Feel free to reach out in the comments if you’d like a copy of a basic template to get started, or if you have your own cool Google Sheets tricks for portfolio analysis!
The Power of Knowing Your Portfolio
Taking the time to set up a system like this empowers you to move beyond passively holding investments to actively understanding them. It helps you make data-driven decisions, spot opportunities, manage risk, and ultimately, stay more aligned with your long-term financial goals. It’s about transforming a potentially “gut-wrenching” task into a streamlined and insightful process.
Cheers to smarter investing!
Trusted Tools & Services
I genuinely use these every day. If you sign up through these links, we both get a win.
Lifestyle & Ridesharing
ClassPass
Get 20 bonus credits for free (on top of the standard free trial) to try out local fitness studios and wellness spas.
Uber
Get 50% off your first 2 rides (up to $10 each). Perfect for your next trip or night out.
Lyft
Get 50% off your first 2 rides. A great alternative for reliable transportation.
Finance & Investing
M1 Finance
Get a $75 bonus when you sign up and fund a new investment account with at least $100.
Robinhood
Get a free stock (worth up to $200) just for signing up and linking your bank account.
Chase Sapphire Reserve® & Preferred®
Earn a massive sign-up bonus (75k-125k points) which can be redeemed for over $1,000 in travel through Chase Travel℠.
Chase Business Cards
Earn up to 200,000 bonus points or $1,000 cash back to jumpstart your business expenses.
Venmo
Get $5 for free after you sign up and make a qualifying payment of at least $5.
Webull
Get up to 20 free stocks when you fund your account with any amount (even just $0.01).
Coinbase & Coinbase One
Get $10 in Bitcoin after you trade $100, plus a $10 discount on your first month of Coinbase One.
Monarch Money
Get an extended 30-day free trial (instead of the usual 7) to organize and track all your financial accounts in one place.
Kalshi
Get a $25 bonus to start trading on real-world events like weather, interest rates, or elections.
MaxRewards
Supercharge your credit card rewards and perks. New users get a free month of MaxRewards Gold to automate offer activations and maximize points. Use code: lp528